In the realm of data science, the journey begins with data exploration. It’s the initial step that sets the stage for the entire data analysis process. This crucial phase is known as Exploratory Data Analysis (EDA). EDA is like peering through a magnifying glass at a treasure map, revealing patterns, anomalies, and insights that may be concealed within your data. In this article, we will delve into the essence of EDA, its significance, techniques, and how it empowers data scientists and analysts to make informed decisions.
Understanding Exploratory Data Analysis
Exploratory Data Analysis is an investigative approach to examine data sets, seeking to summarize their main characteristics, often with the help of graphical representations and statistical techniques. It’s a crucial preliminary step before diving into more complex analysis or modeling. EDA aims to answer essential questions like:
- What does the data look like?
- Are there any notable trends or patterns?
- Are there any outliers or anomalies?
- What relationships exist between variables?
Why is EDA Important?
EDA serves multiple critical purposes in data analysis:
- Data Quality Assessment: It allows data scientists to identify and rectify issues like missing values, duplicates, and outliers, ensuring that the data is reliable and accurate.
- Pattern Recognition: EDA helps in spotting trends, correlations, and patterns that can be further explored and utilized in modeling and decision-making.
- Assumption Validation: It helps to validate assumptions made during the analysis and select appropriate statistical techniques.
- Feature Selection: EDA aids in selecting the most relevant features (variables) for modeling, which can improve model performance and reduce computational complexity.
- Communication: EDA often involves creating visualizations that make it easier to communicate findings and insights to non-technical stakeholders.
Techniques and Tools for EDA
Exploratory Data Analysis employs a variety of techniques and tools to unveil the hidden aspects of data. Here are some commonly used methods:
- Descriptive Statistics: Measures like mean, median, standard deviation, and quartiles provide a quick summary of the data’s central tendency, spread, and distribution.
- Data Visualization: Graphical representations such as histograms, box plots, scatter plots, and heatmaps help in visualizing patterns, relationships, and outliers.
- Correlation Analysis: This technique explores the relationships between variables, often using correlation coefficients to measure the strength and direction of relationships.
- Outlier Detection: Statistical tests and visualization techniques like the Z-score, IQR, and scatter plots help identify outliers that might skew the analysis.
- Dimensionality Reduction: Techniques like Principal Component Analysis (PCA) and t-Distributed Stochastic Neighbor Embedding (t-SNE) reduce the dimensionality of data while preserving its essential characteristics.
- Clustering and Segmentation: Unsupervised learning algorithms can be applied to group similar data points, revealing underlying structures within the data.
- Time Series Analysis: EDA for time series data involves analyzing trends, seasonality, and identifying potential forecasting models.
- Geospatial Analysis: For spatial data, EDA involves mapping, spatial autocorrelation, and hotspot analysis.
- Textual Analysis: When dealing with text data, EDA may include techniques like word frequency analysis, sentiment analysis, and topic modeling.
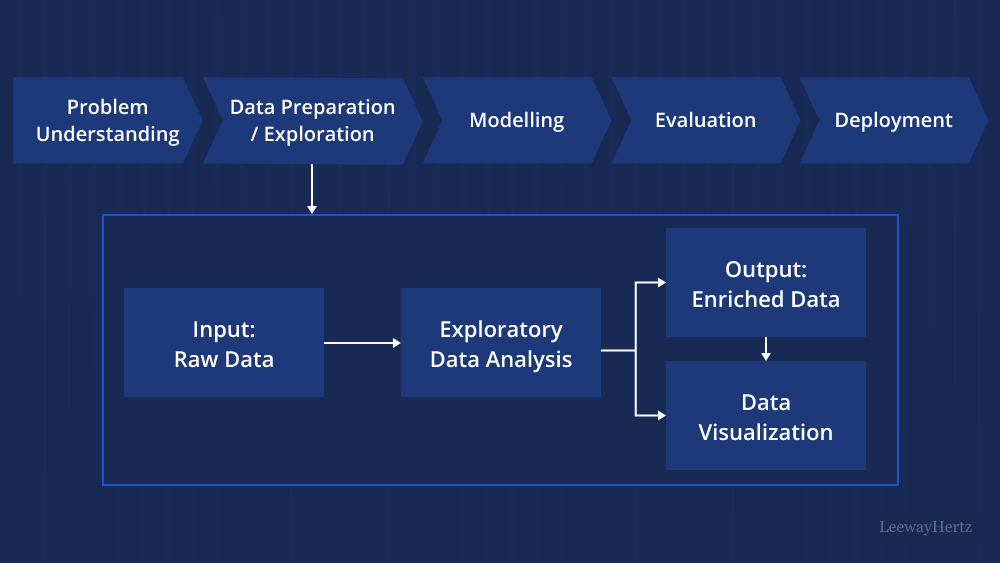
The EDA Process
The EDA process is not a one-size-fits-all approach; it varies depending on the dataset and the questions being asked. However, a typical EDA process may involve the following steps:
- Data Collection: Gather the dataset and relevant metadata.
- Data Cleaning: Address missing values, duplicates, and outliers.
- Data Visualization: Create visualizations to explore the data’s distribution, relationships, and patterns.
- Descriptive Statistics: Compute summary statistics to understand central tendencies and variabilities.
- Hypothesis Testing: Test hypotheses and assumptions about the data.
- Advanced Analysis: Apply specific techniques like clustering, regression analysis, or time series analysis as needed.
- Interpretation: Interpret the findings, draw conclusions, and identify actionable insights.
- Communication: Present the results using clear visualizations and explanations.
Conclusion
Exploratory Data Analysis is the foundation upon which data analysis and modeling rest. It’s the process of understanding the data’s nuances, uncovering hidden gems, and ensuring data quality. EDA empowers data scientists and analysts to make informed decisions, develop accurate models, and communicate insights effectively. Whether you’re exploring a new dataset or embarking on a data-driven project, remember that the journey begins with exploration, and EDA is your trusty compass on that path. So, take the time to explore, visualize, and understand your data; you might just discover the secrets it holds.
